
This post is part of a larger series on Security+
Common userspace utilities
- ping: Sends ICMP echo request to the destination, expects an ICMP echo reply but if not received before the timeout, will display as such. If a response is received, the RTT will typically be displayed in the output for each response. Implementations differ between operating systems and userspace utilities.
# Windows uses -t to get correct, sane behavior

ping -t 8.8.8.8
- netstat: netstat will show network connections for transmission control protocol (incoming and outgoing), routing tables, as well as protocol statistics.
# Windows uses netstat -a to show ports which the system is listening on as well

netstat -a
- tracert: will display possible routes and measures transit delays of packets across an IP network. Windows uses tracert to send ICMP echo requests with an incrementing TTL starting from 0 until the specified is matched with an ICMP echo response. By default, it will perform reverse DNS lookups (PTR queries) to provide you with a hostname if possible. You can specify -d to prevent reverse DNS lookups which speed up the process drastically.
tracert -d stevenpolley.net
- arp: allows displaying or manipulating the ARP cache. Can be used to investigate arp poisoning and L2 issues.
arp -a
- ipconfig / ip / ifconfig (depracted): answers “who am I, and how am I configured”
# Windows L3 configuration
ipconfig

# Windows L3 and L2 configuration
ipconfig /all

# Linux L3 configuration
ip addr

# Linux L2 configuration
ip link

# Linux deprecated userspace utility
ifconfig
- nslookup/dig/drill (drill not on exam): you need to know how to make DNS queries using these tools. It’s important to know that nslookup performs DNS queries independent of system configuration, including the hosts file, cache, or if you have different DNS servers configured - it will perform a full DNS query when it’s run - that’s interesting and important for troubleshooting purposes.
# Windows interactive mode to get MX record using 8.8.8.8 as DNS server
# You can change mx for soa or ns or any other type of record.
nslookup
server 8.8.8.8
set type=mx
stevenpolley.net

# Linux dig command
dig @8.8.8.8 stevenpolley.net MX
- netcat: able to open and listen on ports or act as a client on any port you want. That’s pretty cool - it’s like a swiss army knife. It obviously won’t respond correctly like a server implementation would unless it’s configured to do so, but can read incoming information (as a server) or responses (as a client) - that’s pretty neat!
# netcat server listen on TCP port 8080
netcat -l 8080

# you can direct STDOUT to a file if you wish
netcat -l 8080 > file.out

# netcat as a client - STDIN is transmitted
netcat stevenpolley.net 8080

# you can also transmit a file
netcat stevenpolley.net 8080 < file.in

# you can also capture a response to a file
netcat stevenpolley.net 8080 > file.out
Network Scanning
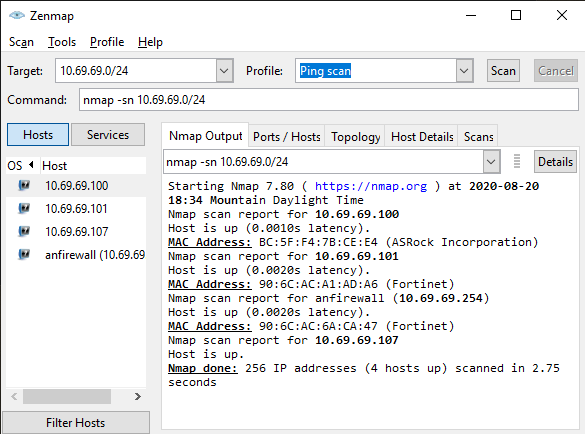
Network scanners allow us to tell what systems are running on a particular network - or at least the systems that tell us they’re there when we ask certain questions. The most commonly used network scanner is nmap. Nmap has many command-line switches which allow you to define specifically what type of scanning you would like to perform, and it also allows you to define/constrain your scan to a specific set of IP hosts.
It’s important to understand that network scanning can be a disruptive activity if you are performing an aggressive scan. I’ve seen some pretty crazy stuff as a result of this - for example, performing an aggressive network scan which tried to connect on every single TCP and UDP port of every single host in the building at a large network, and trying to get all information possible about every device by running various tests… well that was a bad idea. For some reason, a bunch of printers started printing like a hundred pages of nearly full black ink on the entire page. Whoops. One common approach to tread lightly is to do a ping scan, sometimes referred to as an ICMP sweep of a network.
# perform an ICMP sweep of 10.69.69.0/24 with verbose output.   This is equivalent to running one ping/ICMP echo request to every single IP address from 10.69.69.0 to 10.69.69.255.
nmap -v -sn 10.69.69.0/24
If you’re afraid of the CLI or afraid of investing 10 minutes of learning for many hours of accumulated saved time, there is a GUI for Nmap as well.
Netcat may also be used for port scanning - although this isn’t required for the exam.
# scan a single TCP port
netcat -zv stevenpolley.net 80

# scan a range of TCP ports
netcat -zv stevenpolley.net 80-82

# scan multiple discontiguous ports
netcat -zv stevenpolley.net 80 443 8080
- Rogue System: is any system that should not be on the network. It doesn’t necessarily mean evil, but just a system that does not belong there. It could be innocent as someone connecting their smartphone to your organization’s wireless network - but it still shouldn’t be there.
Protocol Analyzers
Protocol analyzers allow us to view exactly what messages and protocols are transmitted on a network. Most protocol analyzers have a built-in sniffer, which allows for capturing live network traffic on a system for live analysis or saving to a file for later analysis. The most common sniffer is libpcap, created by tcpdump.org.
Wireshark is the most common protocol analyzer in use today, and it’s completely free. It allows us to view exactly what data
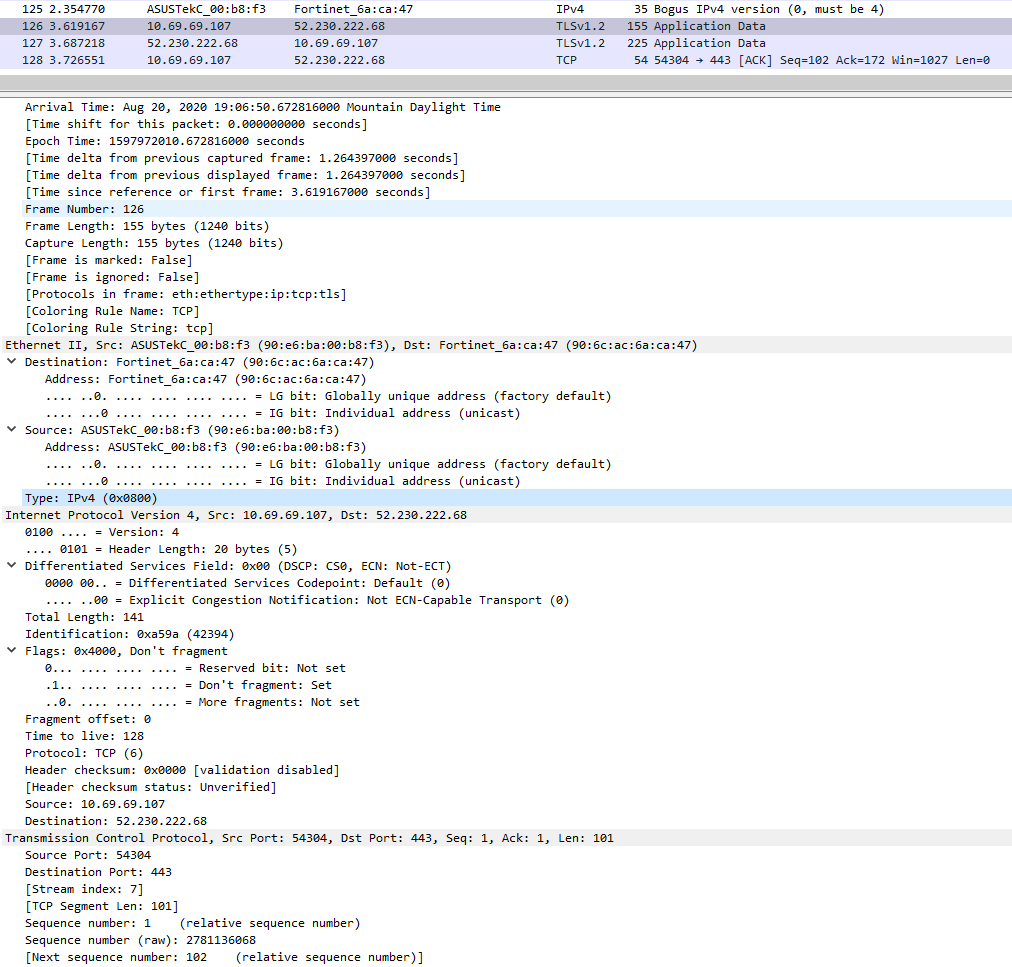
Wireshark allows you to filter and analyze traffic in a variety of ways. It comes in handy for troubleshooting by being able to review in detail, the network traffic being transmitted or received on a host.
You should also be familiar with tcpdump for the exam.
sudo tcpdump
Note: tcpdump is not a protocol analyzer, it is a sniffer
SNMP
SNMP stands for Simple Network Management Protocol. SNMP is a protocol that allows us to administer a variety of network devices that support it. Things such as printers, switches, access points, servers, SANs, routers, and much more often support SNMP.
- SNMP Agent: The software stack/application which is running the SNMP software on a device. The SNMP agent listens on UDP port 161 and if encrypted, UDP with TLS port 10161
- Managed Device: A device which runs and interfaces with an SNMP Agent
- SNMP Manager: A device which runs a Network Management Station
- Network Management Station: The software running on the SNMP Manager. The Network Management Station is the SNMP software the administrator interacts with. It reaches out to all the SNMP agents to configure and monitor them. The NMS listens on UDP port 162 or if encrypted will be TLS 10162.
- Management Information Base (MIB): Different devices have different MIBs. MIBs are essentially a database that contains the commands and queries available for a device to perform specific configuration or get specific monitoring information. A printer’s MIB may have a value for the number of pages printed for example. If the NMS is loaded with the printer’s MIB, it would be able to show this value within the NMS.
- Object Identifier (OID): a unique identity for a managed object, for instance, system temperature, or how many bits of information have egressed an interface or CPU load. Somewhat like a MAC address, the OIDs contain parts specific to a vendor and parts the vendor assigns. These OIDs will be defined with the MIBs provided for the specific devices.
SNMP has different message types
- SNMP GET: a message from the NMS sent to a device to query information about the device
- SNMP TRAP: a trap is configured on the device itself, not the NMS. Configuring a trap comprises configuring a threshold for a monitored value. If the threshold is reached, a message will be sent to the NMS. A common type of trap is one for system temperature - if a device is overheating, your NMS will hear about it. Another common trap is for system performance issues, such as a CPU maxed out on your server.
- SNMP WALK: a walk is like a batch process of GET messages. It allows us to step through all the OID
SNMP has different versions
- SNMPv1: first version, doesn’t have any encryption - everything is in clear text and unauthenticated
- SNMPv2: encryption was introduced, but has weak encryption
- SNMPv3: very good encryption, uses transport layer security.
It’s very common to be running multiple versions of SNMP due to whatever specific devices support. Critical devices typically support SNMPv3 whereas many common devices may only support SNMPv2.
SNMP typically has two levels of authorization, read-only or write - depending on whether SNMP is only being used for monitoring or also for configuration, you should use the principle of least privilege.
Logs

What are logs even? Logs capture events that occur which can help an administrator understand why a system is in the state that it’s currently in. It allows you to investigate what has happened.
Properties of Log Entries
- Date
- Time
- Process/source
- Account
- Event Number/ID
- Event Description
Non-Network Events
- Operating system events
- Host starting
- Host shutdown
- Reboot
- Services/Daemons starting, stopping or failing
- Hardware failures
- Operating System updates
- Application events
- Application installation
- application starts or crashes
- Security events
- Successful logons
- Failed logons
Network Events
- Operating system events
- Remote logons (failed or success)
- Application events
- Web servers
- Firewall activity
Common Log Locations
Depending on the type of system, and also application, logs may be stored in a variety of formats and locations on the system. It’s best to refer to your product’s documentation. Common log locations on these OS’s are:
- Windows - Event Viewer (not responding)
- Mac - Console
- Linux - /var/log
Decentralized logging is where each device is gathering and storing its own log files, there is no central spot to look at all your system’s logs. As your network scales up, this makes it hard to review and gain insight from logs as you would need to gather all these individual logs every single device manually. Centralized logging allows you to gather and review all your system’s logs from one central location.
Monitoring as a Service (MaaS) is a common business to business service to review and monitor logs.
You should understand how to read a log entry and answer questions about what is going on in a situation for the exam. Generally, it’s just pulling information out like dates and times and correlating the messages together to answer a question.
Physical Hardening
- Removable Media Controls: Can be set in local security policy on Windows
- Data Execution Prevention (DEP): Helps prevent data from being executed which could lead to privilege escalation and arbitrary code being run. It’s configured under the Advanced System Settings in the Advanced Tab in the Performing Settings area.
- Disabling Ports in BIOS: You can also physically disable ports in a lot of BIOSs
RFI, EMI & ESD
- Radio Frequency Interference (RFI): EMI which is in the same frequency of a radio
- Electromagnetic Interference (EMI): almost all electronics emit radiation
- Electrostatic Discharge (ESD): electrostatic discharge can damage electronics if you’re charged and you touch it. You can use an antistatic wrist strap to prevent damaging equipment while working on it.
Host Hardening
- Disabling Unnecessary Services:
- Disable Unneeded User Accounts:
- Patch Management: Monitor for new patch releases to come out. Test patches first, deploy in sandbox environment first. Evaluate the patch and determine whether there is upside or downside. Deploy the patch. Document what is being patched and what isn’t.
- Antimalware: training for users, how to handle a malware incident (reporting, who to talk to)
- Host Firewalls:
Analyzing Output
It’s important to be able to look at something and tell what’s going on. This is in a general sense, not just reading through log files and determining a cause for some state. It’s also looking at the state and output, as things are happening as well.