I always get a kick out of reading reliability statistics presented by hard drive manufacturers. They always post these crazy numbers for their reliability stats. Not to pick on Western Digital (they are my personal favorite), but take a look at what they report on these WD Gold drives.
2.5 million hours is over 285 years. Hard drives haven’t even been around that long, so how can they rightly claim the their product on average doesn’t fail for 285 years? It’s all in the details of how they make these measurements in the first place and a lack of accounting for wear and tear.
Ergodicity
Ergodicity is an important property to consider and comes up time and time again when analyzing time-series datasets. If a set of data is considered ergodic, it means there is no difference between taking many measurements in parallel for a short period of time compared to taking one measurement over a long period of time.
An example of an ergodic system is flipping a coin. There is no difference between me flipping one coin 100 times or me flipping 4 different coins 25 times - assuming all coins are equal in their mass distribution. I can either take one long measurement of a single coin being flipped repeatedly, or I can take several measurements of multiple coins being flipped repeatedly - but for less flips. Using either method, the result will converge towards the same output - heads and tails 50/50.
A dataset is considered non-ergodic if the average over many data points of a single system diverges from the average of few datapoints over many systems. Hard drive reliability testing over time is non-ergodic, the way they test these drives diverges from they way the drives are used in reality. This is very common in systems in which there is no activity for a large time, and then one event or series of events in rapid succession changes the output. For example, lets say a hard drive works for several years, and then one day it just doesn’t. That’s a sudden event in which things were 100% fine, and then suddenly, they were 0% fine.
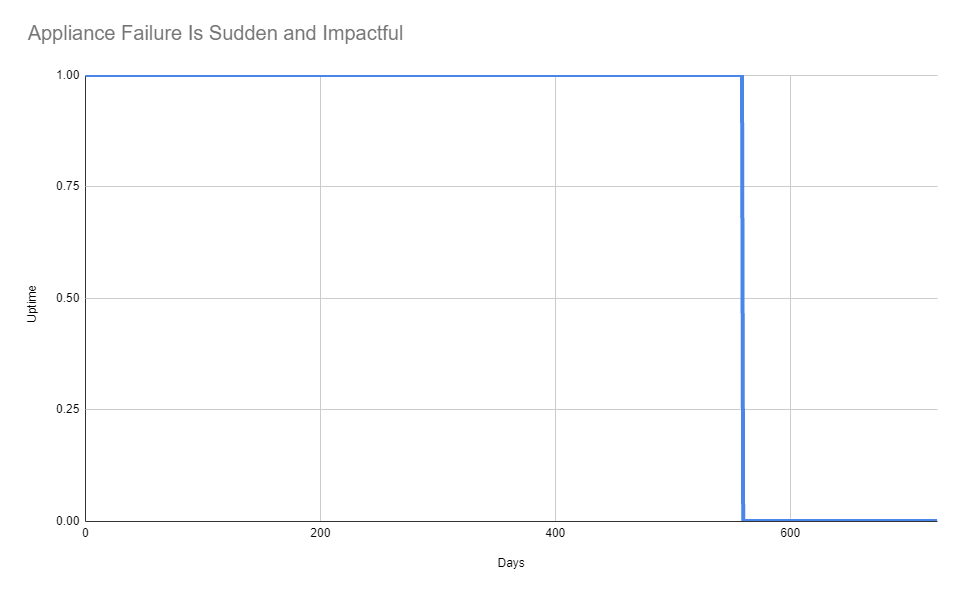
What’s not accounted for in the graph above however is wear and tear over time - all that’s measured is whether it works or not. You can imagine as time goes on, the drive is more likely to fail due to wear.
So how do they get these insane numbers?
Basically, they run many hard drives at once for a short period of time. Just as an example, running 10,000 hard drives for one year will result in a better MTBF compared to running 1 hard drive for 10,000 years. Running 1 drive for 10,000 years will of course result in a 100% failure rate, whereas the latter will likely be close to, but maybe a bit higher than 0%.
If they run 10,000 hard drives for a year and 4 of them fail during their testing, they will claim an MTBF of 250 years.
(10,000 drives / 4 failures) * 1 testyear = 250 years MTBF
Because we don’t know the parameters of their testing (how many drives were tested, for how long), we must take these numbers with a grain of salt. In my opinion, this practice is extremely misleading to customers, but it’s unfortunately commonplace.
The real world has non-constant failure rates
This all breaks down very quickly in the real world, as the failure rate is not constant - especially in components with moving parts. As parts wear down over time, they haven’t yet crossed the threshold of failure, but they’re approaching it ever closer. This means the rate of failure is non-constant and will increase over time. Wear and tear simply isn’t accounted for in the numbers reported.
Unless testing practices are standardized across all manufacturers, the numbers have no relative baseline. Even if they are standardized, one manufactures drives may have excellent performance in the first 3 years but drastically drop off afterwards - indicating excellent consistency in their manufacturing practices and producing consistent initial quality, but perhaps poor quality overall. Another manufacturer may have more fail in the first year but then have many that last much longer than 3 years, indicating poor consistency in their QA but perhaps better quality overall.